| Status | Available / Under development |
| Access arrangements | ">Contact Dr Owain Kenway |
| Organisations | University College London, ARM, NVIDIA, Lenovo |
| Project linkage | All ExCALIBUR projects are involved in the Benchmarking at Exascale element of the project |
The Adaptable Cluster project created a testbed interconnect demonstrator consisting of two non-blocking interconnect fabrics supporting up to 60 attached nodes in a dual fabric configuration.
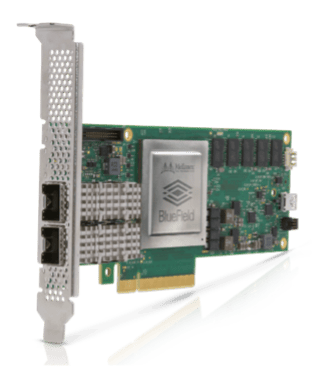
One fabric is 200 Gbps HDR Mellanox Infiniband configured so that it is possible to construct multi-hop routes between nodes. The second fabric is 100Gbps Mellanox Ethernet, with BlueField adaptors on each node. This allows us to measure the impacts of a variety of in-network technologies – doing computation at the switch level (requiring multiple hops) and looking at the possibility of using acceleration on the adaptor to off-load some of the work of the host machine (the BlueField cards). It also becomes possible to gauge the “state of the art” in using Ethernet as an Interconnect with Infiniband, to measure whether on RDMA on Converged Ethernet has reached the point where it is a performant, cost effective interconnect.
UCL is also the location of the ExCALIBUR instance of the ARM FORGE Application. This is an application that supports the debugging, profiling and optimisation of codes that use distributed resources, such as a cluster. It is both CPU and GPU enabled. UCL will support ARM FORGE for key centres in the ExCALIBUR project. It will also be available to UCL projects that are not associated with ExCALIBUR. This package enables jobs that use up to 2048 cores to be analysed in terms of code efficiency. One outcome of this project will be methodologies that enable results from Prometheus and ARM Forge to be used to improve system design, architecture performance and application performance.
In order to understand system and application performance the Adaptable Cluster collects metrics from several sources in the system and dashboards to visualise them, which then allow focus on how to improve system design and resource usage. Alerts can be set up to draw attention to performance issues as well. The testbed uses components such as Elasticsearch, Kibana, Logstash and Prometheus to provide insights into both breadth and depth of system and application performance.